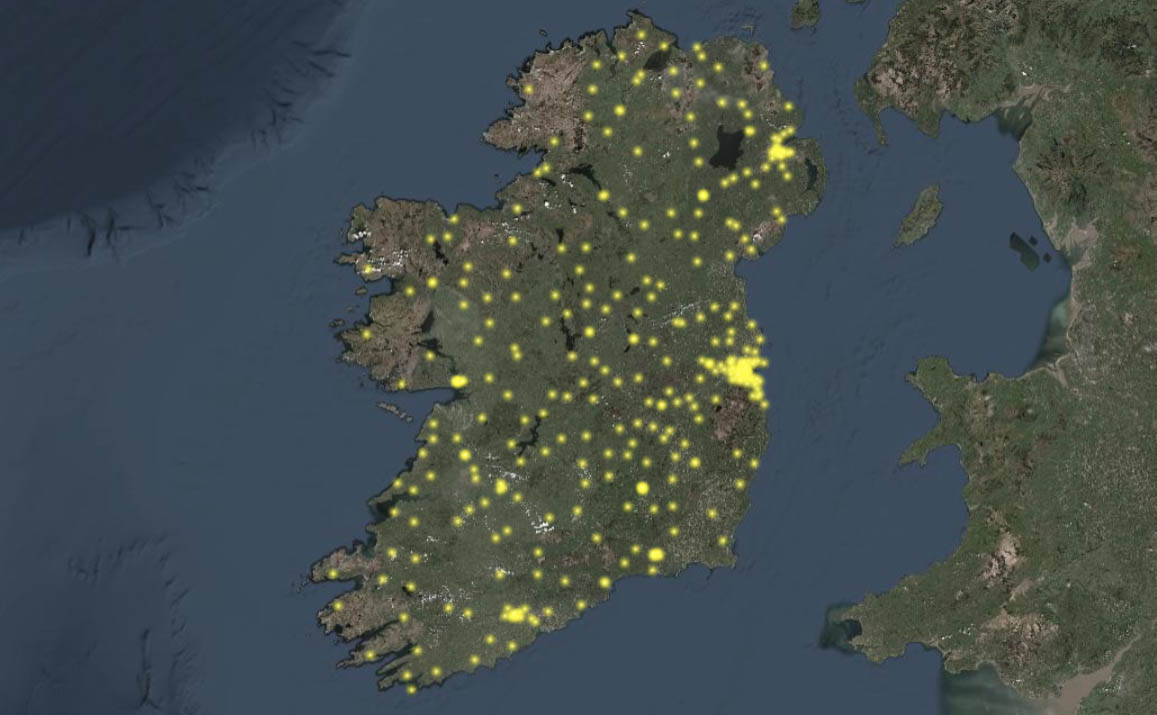
Causeway Coast and Glens Borough Council leverages digital mapping to keep community informed and support local business. #Mapping #GIS #Esri

Esri Ireland, the market leader in Geographic Information Systems (GIS), today announces that Causeway Coast and Glens Borough Council is using its digital mapping platform to develop a number of interactive resources to keep the public informed and support local business throughout COVID-19.

Built using Esri’s mapping software ArcGIS, the council created an interactive Open for Business map, which shows what shops and services are available to the public throughout the borough. The map also shows business opening hours, delivery and collection information and what safety measures the business has in place, all helping to support local enterprises as they reopen.

Causeway Coast and Glens Borough Council COVID-19 Vulnerable and Isolated Persons GIS Dashboard.


A dedicated COVID-19 information and advice hub also built using ArcGIS is available on the Causeway Coast and Glens Borough Council website and homes a wide collection of resources with further information and advice for local businesses, vulnerable members of society and the wider community in the area.

The council’s COVID-19 Coordination Hub connects people to vital community support services and has had more than 1,200 referrals to date from Advice NI and the Northern and Western Health and Social Care Trusts. It helps provide an important continuation of services and access to supports for the most vulnerable people during the pandemic.

Formed in 2015 following the merger of four different councils, Causeway Coast and Glens Borough Council provides public services to more 144,000 citizens throughout the region. Since its formation, the council has worked closely with Esri Ireland to implement GIS across the entire organisation, digitally transforming its services to enhance engagement with the public and enable better, more informed decision making.

Esri’s software enables legal and finance teams to view all of the council’s agreements, leases and licences on one secure platform, eliminating the need to review unwieldy paper-based records and saving both time and money for the council.

Esri’s survey app, Survey123, enables field-workers to gather data on mobiles, tablets and laptops from anywhere in the borough. This information, for example on the condition of local facilities and amenities, can be made available to view across the entire council for analysis in real-time.

Philip McLaughlin, Client Manager, Esri Ireland, said: “COVID-19 has highlighted the importance of clear communication between local government and the public. Having already rolled out GIS across many functions, Causeway Coast and Glens Borough Council was well-placed to leverage the power of digital mapping to create numerous rich information resources that are proving incredibly helpful to local businesses and residents.

Causeway Coast and Glens Borough Council has leveraged Esri’s digital mapping technology to create a number of interactive resources to keep the public informed and support local business during COVID-19. Pictured (L-R) are: Nial McSorely, Digital Services Manager, Causeway Coast and Glens Borough Council; David Jackson, Chief Executive, Causeway Coast and Glens Borough Council; and Philip McLaughlin, Client Manager, Esri Ireland.


“In both supporting people and businesses during COVID-19, as well as using GIS to transform its processes and services, Causeway Coast and Glens Borough Council has shown what is possible for a local authority willing to transform how they engage and collaborate with their community.”

Nial McSorley, Digital Services Manager, Causeway Coast and Glens Borough Council, said: “The biggest challenge for us as a council is in how to interpret the sheer volume of information that is available today. With Esri’s digital platform, we can compress all the different information channels into a single source, enabling us to meaningfully analyse and use data to make intelligent decisions.


“As we look to move on responsibly from COVID-19 restrictions, we will again leverage digital mapping to stimulate local tourism and support the reopening of businesses. Beyond that, we will continue to roll out GIS to further areas in the council and ensure all members of our staff can access and use the platform to enhance every aspect of the public services we deliver.”

Esri Ireland launches interactive StoryMap of the History of Pride in Ireland. #Pride #StoryMap

Esri Ireland, the market leader in Geographic Information Systems (GIS), is today launching an interactive StoryMap on The History of Pride in Ireland. Based on Esri’s digital mapping platform, the map allows users to explore the major historic places and dates which have helped lead to positive change and progress for members of the LGBTQ+ community across Ireland.

The timeline of the Irish Pride movement encompasses foundational events as far back as June 1974, when 10 people marched to the British Embassy in Dublin to protest against the criminalisation of homosexuality. The map provides information on the first official Pride Week in the city in 1979, through large scale LGBTQ+ protests in the 1980s and up to the same-sex marriage referendum in 2015.

Esri Ireland launches interactive StoryMap of the History of Pride in Ireland.

The StoryMap blends together maps, images, text, embedded videos and tweets, and links to further articles and information to present a comprehensive history of the Pride movement. Today, it has grown into one of the biggest festivals celebrated in Ireland, with tens of thousands attending the 40th anniversary of the very first Pride Festival last year.

Due to COVID- 19, this year’s festival was moved to a digital format, with the StoryMap providing all the relevant links for anyone wishing to learn more about the virtual parade and concert set to take place on Sunday, June 28th 2020. The StoryMap is available to view at: https://storymaps.arcgis.com/stories/df083b34c03f4f52ac166adcb60a871a

Official data hub launched to provide comprehensive COVID-19 information to public. #DataHub #Covid19

Esri Ireland, the market leader in Geographic Information Systems (GIS), today announces that a new COVID-19 data hub, compiling official figures from the Health Protection Surveillance Centre (HPSC) and the Health Service Executive (HSE), is now publicly available to view.

The data hub is a result of a collaboration between Ordnance Survey Ireland (OSi), the Central Statistics Office (CSO), the All-Island Research Observatory (AIRO) and the Department of Health, with Esri Ireland providing technical support for the hub built using its GIS technology and platform.

All figures and data on the hub are updated in line with the latest national figures. In addition to headline figures on total confirmed cases and total deaths, the hub makes large swathes of entirely new information for the public, including testing figures, ICU admissions and hospital capacity.


Furthermore, the hub presents confirmed COVID-19 case counts by electoral division, enabling detailed analysis of the location of cases and for the first time, bringing geography to the forefront in the management of the virus in Ireland. People can now view accurate and up-to-date information on COVID-19 cases in their locality.

Ireland’s COVID-19 Data Hub can be viewed on the Government’s GeoHive platform at: https://covid19ireland-geohive.hub.arcgis.com/

New online dashboard provides maps and data for COVID-19 cases across Ireland. #COVID19 #cornavirusireland

Esri Ireland, the market leader in Geographic Information Systems (GIS), today announces that Donegal County Council has used its digital mapping platform to create a comprehensive COVID-19 dashboard with information on confirmed cases across the island of Ireland. The freely available online dashboard is updated daily and compiles data from the Department of Health and Public Health Northern Ireland.

The dashboard helps users to visualise data related to the outbreak of COVID-19 throughout the Republic of Ireland and Northern Ireland. Confirmed cases and data can be filtered for analysis by county and district. Charts and graphs on confirmed cases and deaths, as well as breakdowns of age groups, gender and transmission type can all be viewed clearly.

Percentage and actual increases in figures, including the number of healthcare workers infected and number of cases in ICU, can be tracked via the dashboard on a day-to-day basis. Links to official guidelines and information from the HSE, Department of Health, Public Health Northern Ireland and World Health Organisation are also available on the platform.

The dashboard can be viewed at: bit.ly/COVID19-All-Island  

Additionally, Esri Ireland has made available COVID-19 Impact Planning infographics for every county in Ireland. The infographics detail the preparedness of each county for coronavirus, by outlining population breakdowns, work status of population and total numbers of healthcare facilities in the county, such as health centres, hospitals and GPs. Detailed infographics for every county in Ireland are available to view at: https://arcg.is/jmr1C.

Interactive map – Homelessness figures in Ireland. #Esri #Homelessness #Map

Digital mapping company Esri Ireland, has just launched a new interactive online map which highlights on Irish homelessness figures from 2016 to 2019. As we are all aware homelessness is a huge crisis in Ireland and this map will guide to to how bad the situation really is and something to think about.

The dashboard and map present a visual summary of homelessness statistics provided by the Department of Housing, Planning and Local Government. They cover the department’s monthly reports from February 2016 to the latest available (November 2019). The dashboard breaks down homelessness figures by regions across Ireland, as well as providing further detail including age, gender and the numbers in emergency accommodation.

Feel free to check it out HERE