Most local businesses know a few competitors by name. The harder part is knowing whether those familiar names reflect the wider market.
A dental practice may watch nearby clinics. A plumbing company may know the brands that advertise most heavily in its area. Smaller operators, newer entrants and strong businesses a few neighborhoods away are easier to miss.
Google Maps is useful because public listings bring several practical signals together: category, location, rating, review count, website and contact details. For larger competitor sets, G Maps Extractor can turn those listings into structured records that are easier to compare across an area.
Define the Market Before Collecting Data
The first decision is not which tool to use. It is deciding who actually counts as a competitor.
“Dentist” and “cosmetic dentist” are related searches, but they do not describe exactly the same set of businesses. The same problem appears in home services, legal services, fitness, restaurants and many other local categories.
Geography matters just as much. A business may compete heavily within one ZIP code and have very little overlap with customers five miles away.
Before collecting anything, define the service category and the area you want to study. For one business, the city may be enough. For another, a neighborhood, ZIP code or group of suburbs may be more useful.
Making those choices early saves time later and keeps irrelevant listings out of the dataset. If the same research needs to be repeated across many categories or locations, a Google Maps Scraper API can automate collection while keeping the fields consistent.
Ratings, Reviews and Websites Add Context
A competitor count shows how crowded a market looks. It says less about how established those businesses are.
Reviews help with that. BrightLocal’s 2026 Local Consumer Review Survey found that 85% of consumers are more likely to use a business after reading positive reviews, while 54% go on to visit the business’s website.
Consider two clinics. One has a 4.8 rating from 24 reviews; the other has a 4.6 rating from 900. The first has the higher score, but the second has a much deeper review history and stronger visible presence.
Websites are also worth noting. A market where nearly every competitor has online booking, detailed service pages and a modern site looks different from one where many businesses still depend mainly on phone calls and directory listings.
There is no need to turn these signals into a made-up “market strength score.” A side-by-side comparison already tells you quite a lot.
Turn Listings Into Data You Can Compare
Manual research works for ten or fifteen businesses. Once the list reaches a few hundred, browser tabs and copied notes become hard to manage.
A structured table makes it possible to compare the same fields across every listing without reopening Maps each time.
The most useful fields are usually basic ones: business name, category, address, coordinates, rating, review count, website and phone number. Put those into a spreadsheet or database and several comparisons become much easier.
You can group businesses by neighborhood, sort by review volume, flag companies without websites, or separate single-location operators from chains.
Cleaning the data matters too. Duplicate listings can inflate the size of a market, while multi-location brands can distort totals if every branch is counted without context.

City Totals Often Hide the Useful Part
Suppose a city has 250 plumbing companies. The headline number sounds competitive, but the distribution matters more.
Maybe 180 are clustered in the center and south of the city, while the northern suburbs have far fewer. A city-wide total will not show that difference.
Similar patterns appear with dental clinics, gyms, restaurants and home services. Competition tends to cluster around commercial districts, population centers and high-demand neighborhoods.
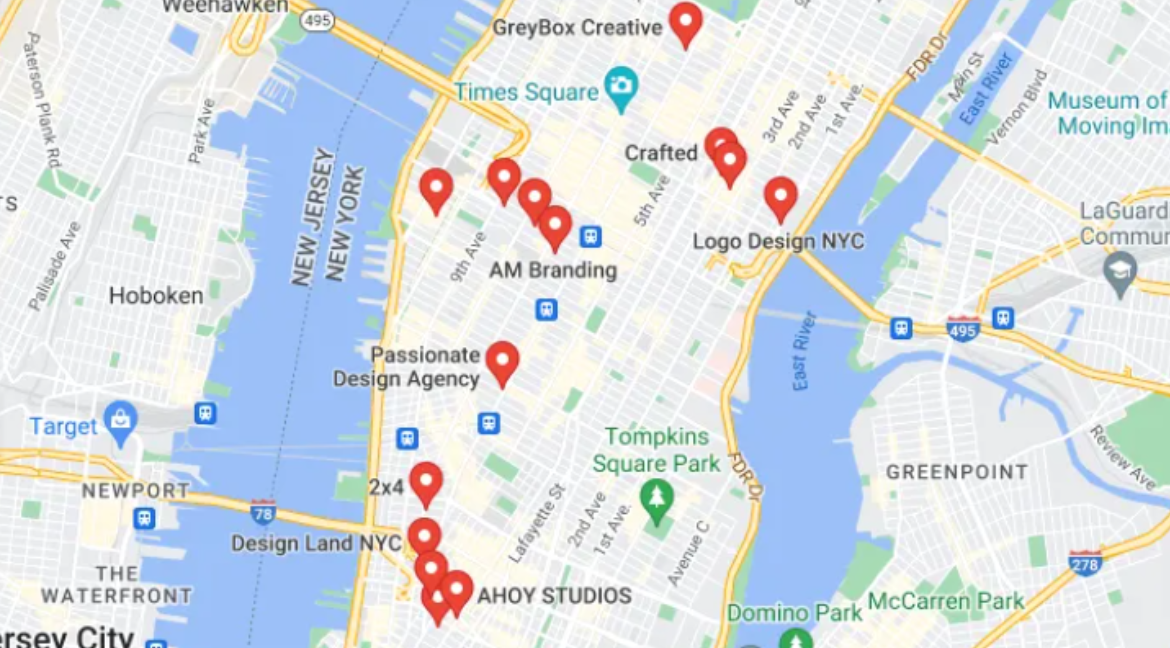
Grouping listings by neighborhood or plotting coordinates makes those patterns easier to spot. It may also highlight areas worth investigating further.
Low competition alone is weak evidence. Fewer businesses can also reflect weak demand, lower population density or higher operating costs.
Scale the Same Research Across More Markets
One city is manageable. Thirty cities quickly becomes an operations problem.
If a franchise, agency or research team compares five categories across 30 cities, that already creates 150 category-and-location combinations before neighborhoods or service variations are added.
Consistency becomes the main challenge. The same fields need to be collected each time, search logic has to remain comparable, and duplicate handling should not change halfway through the project.
For larger projects, those searches can be submitted programmatically and the returned records can feed into a spreadsheet, database or internal analytics tool.
The process can be repeated later to check for new competitors, changes in review counts, website updates or other shifts in the market. For recurring research, this matters more than saving a few minutes on the first export.
Where Google Maps Stops Being Enough
Google Maps is strong at showing which businesses are visible in a local market. It does not explain demand, profitability or customer loyalty.
A business with thousands of reviews may still be smaller than a competitor with a strong offline reputation. An area with few listings may have little competition because customers simply are not looking for the service there. A weak website does not mean the business itself is weak.
Other data sources help fill those gaps. Demographics show who lives in the area. Search demand gives another view of customer interest. Industry reports add broader growth trends. Rent, income levels and internal sales data bring in the economic side.
Google Maps is most useful here as a source of competitor evidence: who is active, where they are located and how strong their public presence appears to be. From there, the next research questions become much easier to define.